CANADA HISTORY - Elections
The Canadian federal election of 1900 was held on November 7, at the dawn of a new century and in the midst of a rapidly changing political, economic, and social environment. The political situation leading up to the election, the leaders of the contending parties, and the issues that dominated the campaign made this election a significant moment in Canadian political history. It saw the incumbent Liberal government of Sir Wilfrid Laurier face a serious challenge from the Conservative Party, led by Charles Tupper, who was a prominent figure in Canadian politics. This essay will explore the political situation before the election, the leaders of the major parties, the key issues, the campaign events, and the ultimate results and aftermath.
Political Situation Before the Election
The political situation in Canada in the late 1890s and leading up to the 1900 election was characterized by a mixture of optimism and uncertainty. The Liberals, under Prime Minister Sir Wilfrid Laurier, had been in power since their victory in the 1896 election, which had ended the long period of Conservative dominance under Sir John A. Macdonald and his successors. Laurier’s government was marked by its policies of compromise and national unity, especially in terms of its handling of the French-English divide. Laurier, Canada’s first Francophone Prime Minister, worked hard to maintain a balance between the interests of Quebec and the rest of the country, something that had become an increasingly delicate task.
Internationally, the turn of the century saw Canada growing in stature within the British Empire. Economic growth, driven largely by the development of western Canada and resource industries, was leading to increased urbanization and industrialization. However, this growth also presented challenges. The economy was recovering from a period of recession, and there were concerns about Canada’s ability to compete in the global marketplace, especially with the United States.
The most pressing issue for Laurier’s government going into the election was the Boer War (1899–1902), which had just begun the previous year. The war between the British Empire and the Boer republics in South Africa had deeply divided Canada. English Canadians generally supported Britain’s imperial efforts and saw the war as a test of loyalty, while French Canadians, many of whom had no strong emotional ties to Britain, opposed Canadian involvement. Laurier had to tread carefully to avoid alienating either group.
Leaders of the Parties
The two main parties in the 1900 election were the Liberals, led by Sir Wilfrid Laurier, and the Conservatives, led by Sir Charles Tupper.
Sir Wilfrid Laurier: Laurier was a masterful politician known for his charisma, eloquence, and ability to bridge divides between English and French Canada. His government had pursued policies that aimed to foster national unity, support economic development, and maintain Canada’s autonomy within the British Empire. He had been careful to avoid direct involvement in imperial affairs that might stir nationalist feelings in Quebec while still reassuring English Canadians of Canada’s loyalty to Britain. Laurier was popular across much of the country, though his handling of the Boer War was a contentious issue.
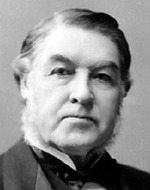
Sir Charles Tupper: Tupper, the leader of the Conservative Party, had been a significant figure in Canadian politics for decades. He had served as a Father of Confederation and briefly as Prime Minister in 1896 before being defeated by Laurier. At 79 years old, Tupper was one of the oldest leaders to contest a federal election. His long career had made him a respected elder statesman, though some viewed his leadership as outdated. Tupper strongly supported Britain in the Boer War and advocated for more vigorous support of imperial causes.
Key Issues of the Election
The Boer War: The most divisive issue of the election was Canada’s involvement in the Boer War. The war, which began in 1899, was highly controversial in Canada. English Canadians generally supported Britain’s efforts and expected Canada to contribute troops and resources to the war effort. On the other hand, French Canadians, led by figures like Henri Bourassa, were firmly opposed to sending Canadian soldiers to fight in what they viewed as a foreign imperial conflict. Laurier had tried to strike a middle ground, sending volunteers to South Africa but refusing to implement conscription or provide official government support for the war. This policy pleased neither side fully, but it helped to defuse a potentially explosive issue.
National Unity: Laurier’s government had made national unity a central theme of its administration. His policies often sought to balance the interests of Quebec with those of the rest of Canada. The Conservatives, under Tupper, accused Laurier of weakening Canada’s ties to the British Empire and failing to stand up for Canadian imperialists’ interests. Laurier’s appeal was rooted in his ability to present himself as a moderate who could hold the country together in the face of division.
Economic Growth and Development: The late 19th century saw significant economic growth in Canada, particularly in the West, where agriculture and resource industries were expanding. Laurier’s government had encouraged immigration to settle the prairies and had promoted railway construction to connect the country’s vast regions. The Conservatives, meanwhile, accused the Liberals of mismanaging the economy and argued that they could do a better job of promoting industrial development and protecting Canadian industries through tariffs.
Trade Policy: Tariffs and trade policy were perennial issues in Canadian politics at the turn of the century. Laurier’s Liberals supported freer trade with the United States and Britain, while the Conservatives were more protectionist and advocated for high tariffs to protect Canadian industries. This debate was important to both business interests in central Canada and farmers in the West, who sought access to broader markets.
The Campaign
The election campaign of 1900 was marked by intense debate over these issues, particularly the Boer War. Laurier focused on defending his government’s record, emphasizing his attempts to maintain national unity and promote economic growth. He also stressed that Canada should remain autonomous in deciding its own foreign policy, particularly regarding imperial matters.
Tupper, on the other hand, ran a campaign centered on imperial loyalty and criticized Laurier’s handling of the Boer War as weak and insufficiently supportive of Britain. He advocated for stronger ties to the Empire and portrayed Laurier as compromising Canada’s imperial responsibilities.
The campaign was conducted under the rules of the time, with limited suffrage and the election being staggered over several weeks. Voter turnout was relatively high for the era, as the issues at stake were seen as important for the future of the country.
Election Day and Results
The election was held on November 7, 1900, and the results were a decisive victory for Laurier and the Liberals. The Liberals won 132 seats, an increase from their previous total of 117, while the Conservatives, under Tupper, won only 81 seats. Laurier’s victory was based on his strong support in Quebec and much of Ontario, where his moderate stance on the Boer War and his record on economic growth resonated with voters. In contrast, the Conservatives performed better in the Maritimes and parts of western Canada but were unable to overcome Laurier’s broad appeal.
Aftermath
The 1900 election solidified Laurier’s position as one of Canada’s most successful and enduring political leaders. His victory allowed him to continue his policies of compromise and national unity, and it demonstrated that his approach to balancing French and English Canadian interests had widespread support. The result also indicated that Canadian voters were not willing to engage fully in Britain’s imperial conflicts, preferring instead to maintain a degree of independence in foreign policy.
For the Conservative Party, the defeat marked the end of Charles Tupper’s long political career. He resigned as party leader shortly after the election, and the party began to search for new leadership to challenge Laurier in future elections.
The election also underscored the growing importance of national unity as a central issue in Canadian politics. Laurier’s ability to bridge the divide between French and English Canada would be tested in the coming years, particularly as debates over conscription and Canada’s role in the British Empire would arise again during World War I.
In conclusion, the 1900 federal election in Canada was a significant moment in the country’s political history. It reinforced Wilfrid Laurier’s leadership and marked a victory for his policies of moderation, national unity, and economic development. The election also highlighted the deep divisions within Canada over issues of imperialism and national identity, divisions that would continue to shape Canadian politics in the years to come.

Wilfred Laurier - Liberal
Charles Tupper - Conservative

John A Macdonald
| Election Party |
Elected Members | # of Candidates | % of Popular Vote | % of Seats |
|---|---|---|---|---|
| 1900 (November 7) - Turnout: 77.4 % | ||||
| Liberal | 132 | 207 | 52.0 % | 62.0 % |
| Conservative | 81 | 204 | 47.4 % | 38.0 % |
| Other | 25 | 0.6 % | 0.0 % | |
| Total | 213 | 436 | ||
| Government--132, Opposition--81, Majority--51 | ||||
| Total - 213 | Conservative | Liberal | Other |
| Canada | 80 | 133 | - |
| PEI | 2 | 3 | - |
| Nova Scotia | 5 | 15 | - |
| New Brunswick | 5 | 9 | - |
| Quebec | 7 | 58 | - |
| Ontario | 55 | 37 | - |
| Manitoba | 4 | 3 | - |
| BC | 2 | 4 | - |
| NWT | - | 4 | - |
Cite Article : Reference: www.canadahistory.com/sections/documents/documents.html
Source: NA