Content for New Div Tag Goes Here
CANADA HISTORY - Elections
election details
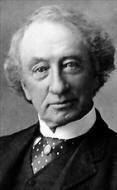
John A Macdonald - Conservative
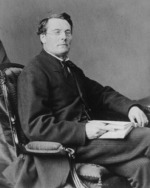
Edward Blake - Liberal
| Election Party |
Elected Members | # of Candidates | % of Popular Vote | % of Seats |
|---|---|---|---|---|
| 1887 (February 22) - Turnout: 70.1 % | ||||
| Conservative | 123 | 209 | 50.7 % | 57.2 % |
| Liberal | 92 | 193 | 48.9 % | 42.8 % |
| Other | 37 | 0.4 % | 0.0 % | |
| Total | 215 | 439 | ||
| Government--123, Opposition--92, Majority--31 | ||||
| Total - 215 | Conservative | Liberal | Other |
| Canada | 123 | 92 | |
| PEI | - | 6 | |
| Nova Scotia | 14 | 7 | |
| New Brunswick | 10 | 6 | |
| Quebec | 33 | 32 | |
| Ontario | 52 | 40 | |
| Manitoba | 4 | 1 | |
| BC | 6 | - | |
| NWT | 4 | - |
Cite Article : Reference: www.canadahistory.com/sections/documents/documents.html
Source: NA